Every year, the battle between iPhone and Android intensifies, with each new smartphone release sparking debates among tech enthusiasts and casual users alike. But beyond hardware specs and software features, iPhone and Android users themselves differ significantly in demographics, behavior, and preferences. Understanding these differences is crucial for businesses and developers aiming to tailor their strategies effectively. Here’s an in-depth look at the key differences between iPhone and Android users in 2025.
iPhone vs Android Users in 2025
Global Market Dynamics: Android Dominates, iOS Excels in Revenue
Android continues to lead the global mobile operating system market with a staggering 70% market share compared to iOS’s 29%. In Europe, the divide is similar, with Android at 67% and iOS at 32%.
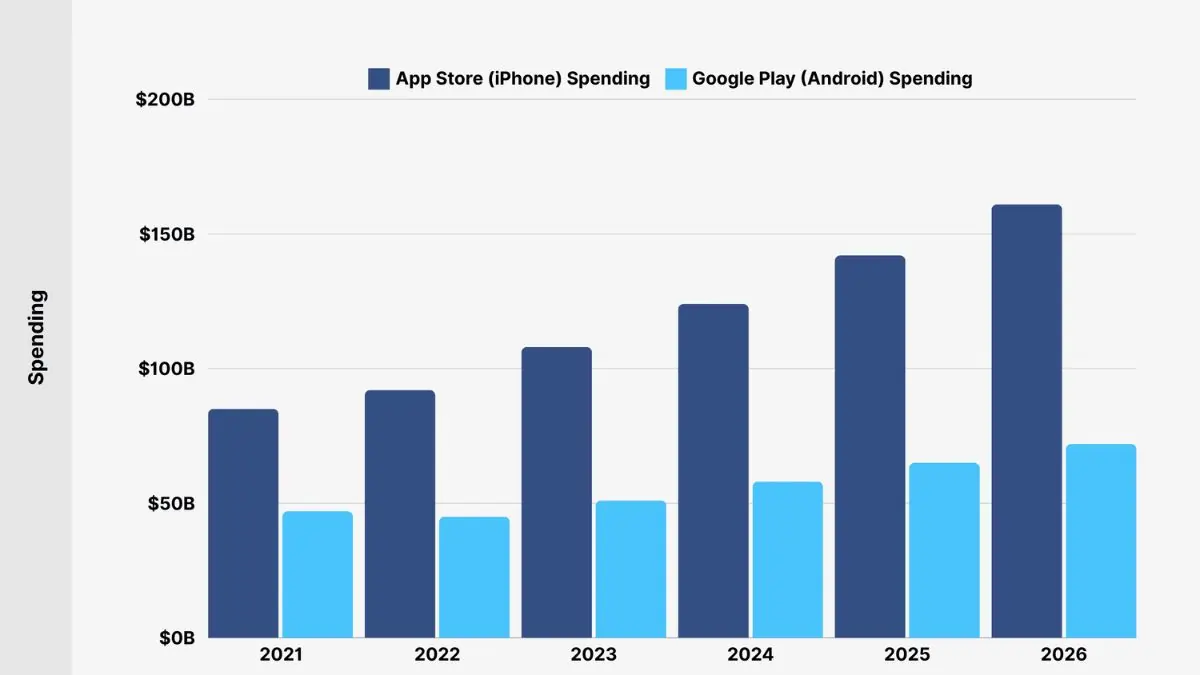
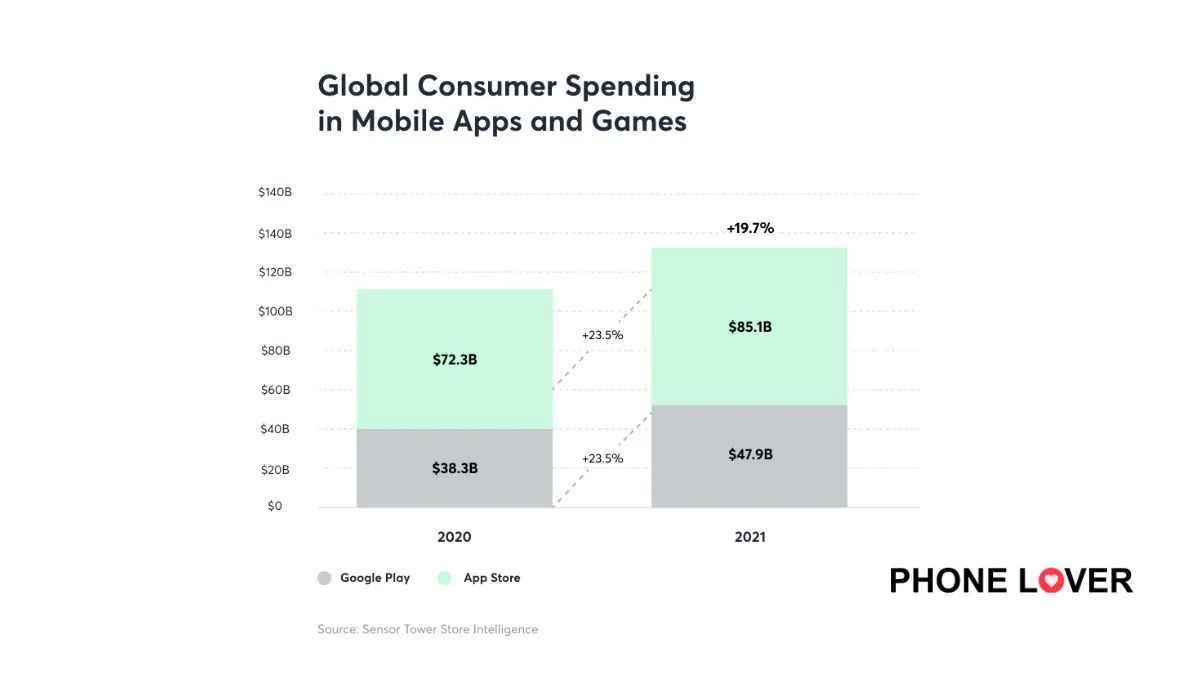
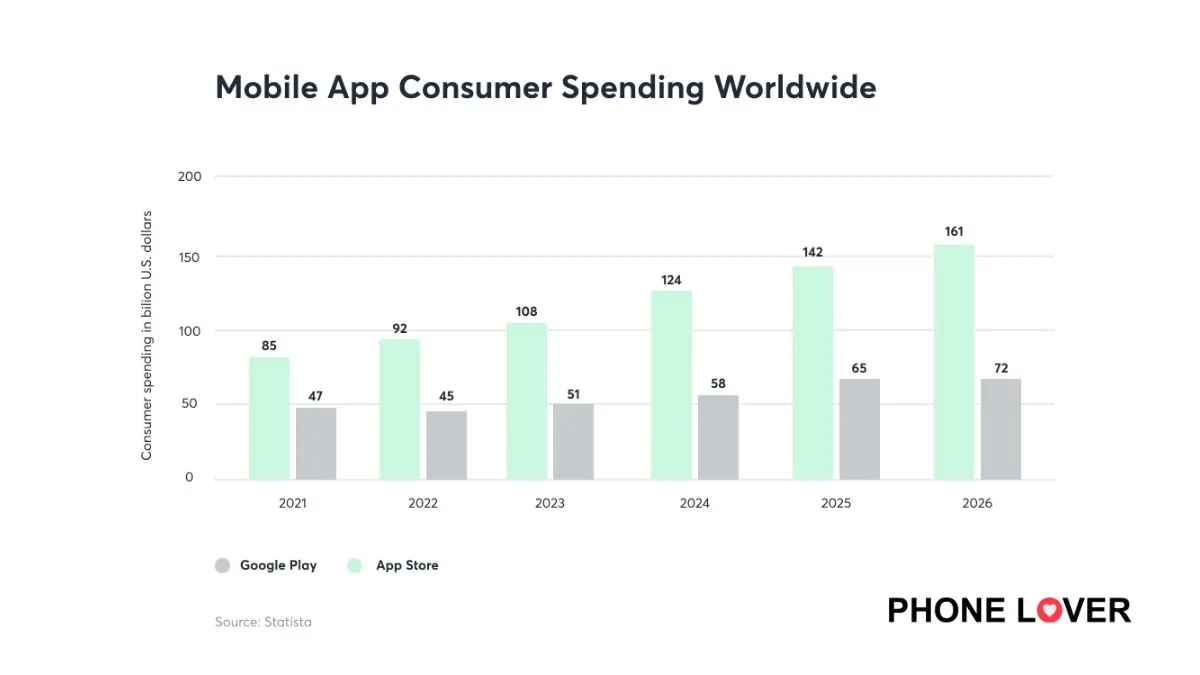
Despite having a smaller user base, iOS leads in revenue generation. In the first half of 2022, Apple’s App Store generated $43.7 billion in consumer spending, nearly double Google Play’s $21.3 billion. This trend highlights iOS’s ability to attract high-spending users, a critical factor for businesses prioritizing monetization.
Demographic Breakdown: Income and Age Differences
Income Levels
Data reveals that iPhone users generally earn more than Android users. A 2024 survey showed iPhone users had an average annual income of $53,251, compared to $37,040 for Android users. This aligns with Apple’s stronghold in the premium smartphone segment, where it holds a 57% global market share for devices priced over $400.
Age Preferences
Younger users tend to favor iPhones, with 44% of 18-29 year-olds using iOS devices compared to 30% on Android. Conversely, Android dominates among older demographics, who appreciate the platform’s affordability and customization options.
Behavioral Insights: Spending, Engagement, and Perceptions
In-App Spending
iPhone users spend more on in-app purchases. The global average per user is $1 on iOS compared to $0.47 on Android. This trend is consistent across subscription-based apps and gaming, where iOS apps account for 76% of total revenue.
Push Notification Engagement
Interestingly, Android users are more responsive to push notifications, with a reaction rate of 4.6% versus iOS’s 3.4%. Android’s opt-in rate for notifications also stands higher at 81%, compared to iOS’s 51%, likely due to Apple’s stricter opt-in policies.
Security Perceptions
While both platforms offer robust security, consumer perceptions favor Apple. A 2022 survey found that 75% of iOS users felt secure after a breach compared to 55% of Android users. This perception bolsters Apple’s brand reputation, particularly in privacy-conscious markets like the U.S.
Why iPhone Leads in the U.S.?
In 2022, iPhone surpassed Android’s market share in the U.S., securing over 50% of active smartphones. Several factors contribute to this:
- Cultural Appeal: Apple’s strong presence in American pop culture.
- Brand Loyalty: Apple’s ecosystem encourages long-term commitment.
- Economic Factors: U.S. consumers are less price-sensitive, and Apple’s devices retain value better for trade-ins.
Customization vs. Consistency: The UX Divide
Customization
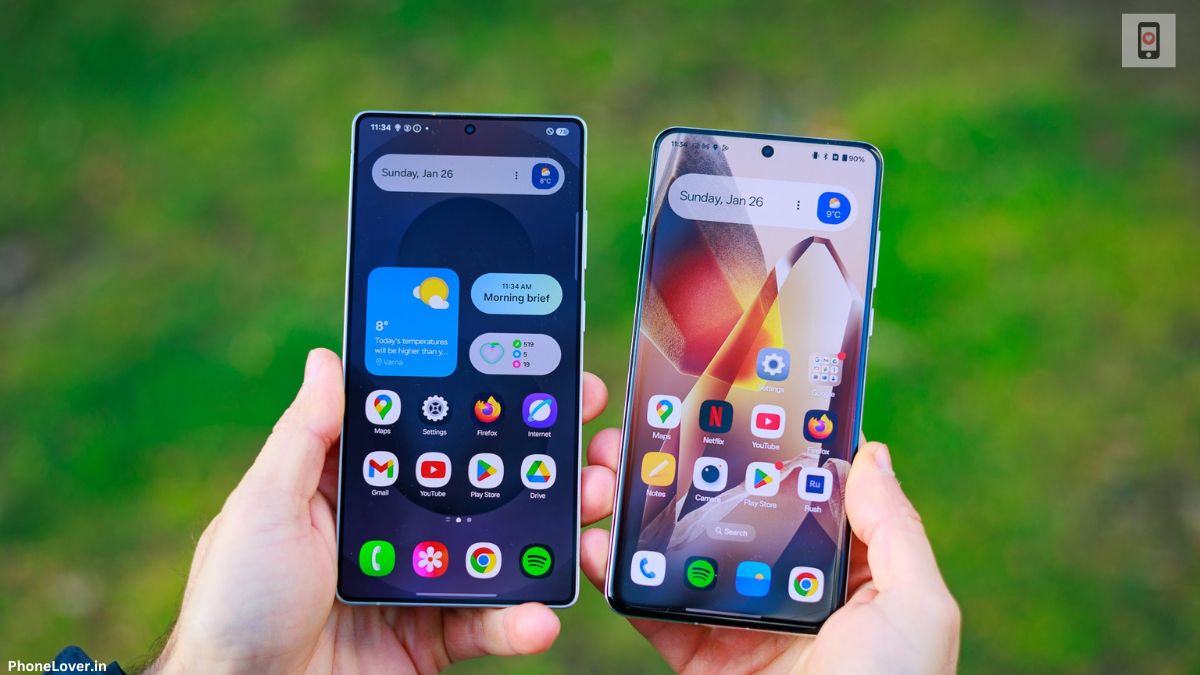
Android offers unparalleled customization, allowing users to tailor their home screens and widgets. This appeals to tech-savvy users who value personalization.
Consistency
iPhones prioritize a uniform user experience, which simplifies navigation and appeals to users seeking an intuitive interface. However, this comes at the cost of limited customization.
iOS vs Android Comparison Chart
for a quick overview of the differences between these two leading mobile operating systems:
| Feature | iOS | Android |
|---|---|---|
| Developer | Apple | Open Handset Alliance & Google |
| Hardware Options | Limited to Apple devices (iPhone) | Available on a wide range of devices from brands like Samsung, Google, Motorola, LG, etc. |
| Programming Languages | Swift & Objective-C | Java, Kotlin, C, C++ |
| Source Model | Proprietary (some open-source elements) | Open Source |
| Language Support | ~40 languages | 100+ languages |
| App Marketplace | Apple App Store (exclusive) | Google Play Store & other marketplaces like Aptoide, Galaxy Apps |
| Customization | Limited | Highly customizable |
| Global Market Share | ~29% | ~70% |
| Number of Apps | 1.6 million | 3.55 million |
| Global App Revenue (2023) | $85.1 billion | $47.9 billion |
| Preferred Age Group | Younger users (18–34 years) | Older users (35+ years) |
| Economic Profile | Higher income on average | More budget-friendly |
| Customer Loyalty | High (~86% retention) | High (~91% retention) |
| In-App Spending | Higher spending per user | Lower spending per user |
| User Response to Push Notifications | Reaction rate: 3.4%, Opt-in rate: 51% | Reaction rate: 4.6%, Opt-in rate: 81% |
| User Perception of Security | Perceived as more secure | Perceived as less secure |
| Developer Compensation (US) | Slightly higher for iOS developers | Slightly lower for Android developers |
This chart highlights the distinctions between the two platforms, helping users and businesses alike make more informed decisions based on their goals and audience.
Considerations for Businesses and Developers

Target Market and Demographics
If targeting younger, high-income consumers in markets like the U.S., iOS should be the primary platform.
For global reach, especially in emerging markets, Android is the better choice.
Development Costs and Timeline
Developing for iOS generally costs more due to higher developer salaries and Apple’s rigorous app approval process. However, the return on investment can be higher due to user spending.
Cross-Platform Solutions
Businesses should consider cross-platform tools like Flutter or React Native to reduce costs and expand their app’s reach across both ecosystems.
